To add designer-quality, professional formatting to a Tabulate table, you can apply a predefined table style. When you choose one of the predefined alternate-row styles, Tabulate maintains the alternating row pattern when you filter, hide, or rearrange rows.
Table elements
A table can include the following elements:
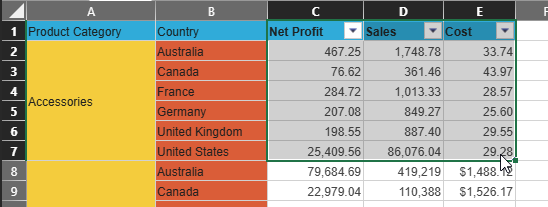
- Header row: By default, a table has a header row. Every table column has filtering enabled in the header row so that you can filter or sort your table data quickly. For more information, see Filtering and Sorting Tables.
- Banded rows: Alternate shading or banding in rows helps to better distinguish the data.
- Calculated columns: By entering a formula in one cell in a table column, you can create a calculated column in which that formula is instantly applied to all other cells in that table column.
Creating a table
You can create as many tables as you want in a Tabulate sheet, although they cannot overlap.
To quickly create a table in Tabulate, do the following:
- Select either any cell within the table or any range of cells that you want to format as a table.
- On the Tabulate ribbon, do one of the following:
- Click Tables to convert the selected cells into a table.
- Select Tables > <Style> to create the table and apply a particular style to it. The <Style> options change the appearance of the table, including colors, fonts, and so on, and are sorted into Light, Medium, and Dark groups.
The table is "created" from the selected data and formatted with reference to your <Style> selection. The Table Design ribbon opens at the top of the canvas.
Tip: By default, you can resize the table by dragging the Resize Handle at its bottom-right corner. The table either expands to include new rows or columns or shrinks to remove them.
Table Design
Whenever a table is selected, including when it is initially created, the Table Design ribbon opens at the top of the canvas. This ribbon provides tools to format the table:
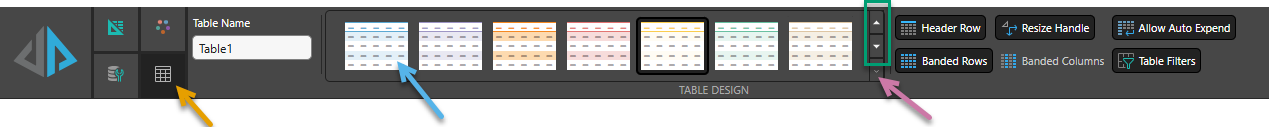
Table Name
Assign a unique name to the table.
Table Styles
This Style selector allows you to access the same preset formatting options that you may have selected from the Tables dropdown list when creating your table. The <Style> options change the appearance of the table, including colors, fonts, and so on, and are sorted into Light, Medium, and Dark groups.
- Use the Up and Down arrows (green highlight) to scroll through the available styles.
- Use the <Style> dropdown list (purple arrow) to expand the styles panel so that you can see all of the available styles in one view.
- Click the snapshot (blue arrow) to select and apply a style to your table.
Toggle options
Use these buttons to turn formatting features on or off. When selected, each option has the following effect:
- Header Row: Makes the first row of the table into the header that labels each column.
- Resize Handle: Allows the user to drag the resize handle at the bottom-right corner of the table to change its size.
- Allow Auto Expand: Expands the table automatically as you add data into adjacent cells. This means, for example, that a new column is incorporated into the table as data is added alongside an existing column.
- Banded Rows: Applies alternating shading to table rows.
- Banded Columns: Applies alternating shading to columns.
- Table Filters: Shows filter dropdown arrows in the header row that allow you to sort, filter, and search the column data.